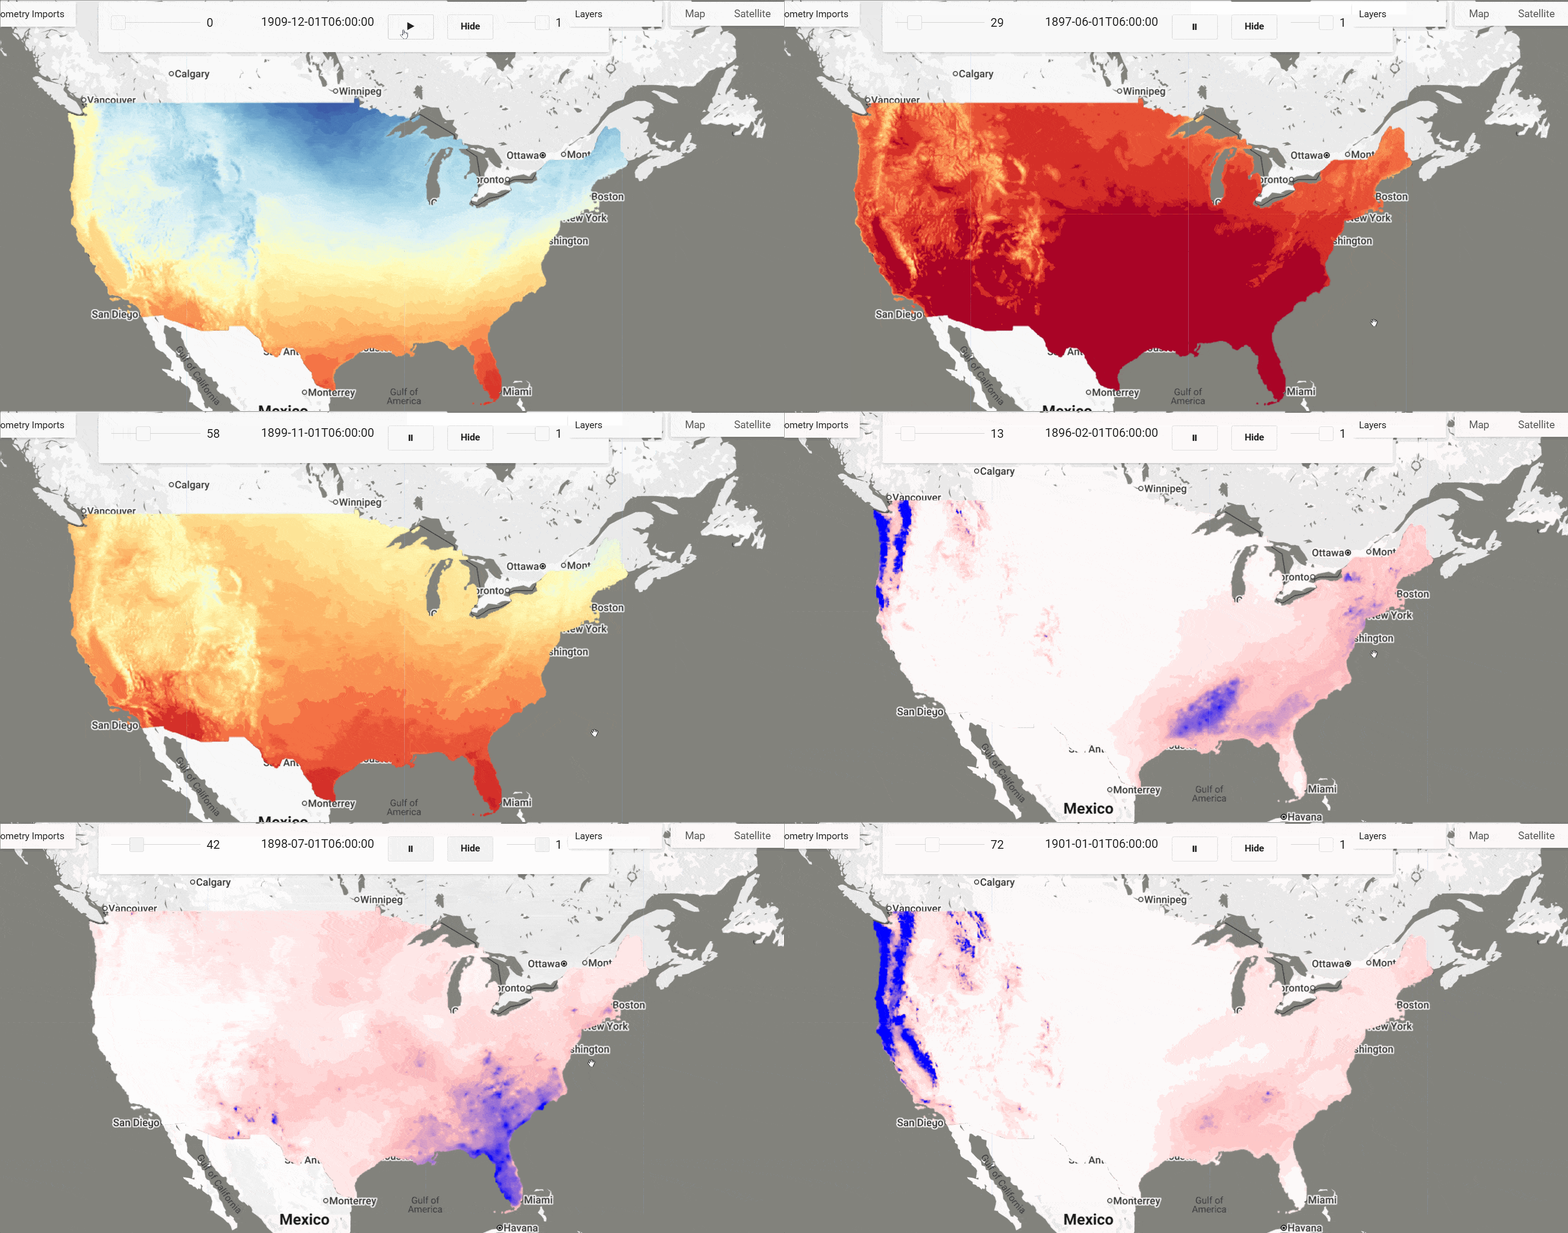
PRISM Climate Dataset (800m Resolution) Daily
The PRISM Climate Dataset provides high-resolution, spatially explicit climate information for the conterminous United States. It uses the Parameter-elevation Regressions on Independent Slopes Model (PRISM) to generate gridded estimates of key climate variables by leveraging weather station data and a digital elevation model. The 800m resolution dataset represents the native, highest-detail version, offering unparalleled insight into the complex influence of topography on local climate patterns.
The PRISM dataset is developed and maintained by the PRISM Climate Group at Oregon State University. It offers a long-term, spatially continuous record of daily and monthly climate variables, including precipitation, temperature (minimum, maximum, mean), dewpoint temperature, and vapor pressure deficit. The underlying model, PRISM, is a hybrid statistical-geographic approach that uses point measurements of climate data and a digital elevation model (DEM) to generate gridded estimates. The model's key strength lies in its ability to account for complex climate-elevation relationships and topographical features like rain shadows, temperature inversions, and coastal effects, which are critical for accurate climate mapping, especially in mountainous regions.
The PRISM methodology has been extensively validated and is considered a benchmark for climatological mapping in the US. Its accuracy stems from a weighted regression scheme applied to local station data, where the weighting is influenced by distance, elevation, and the topographical orientation of the landscape. The resulting grids are widely used in hydrology, agriculture, ecology, and resource management. For full details on the methodology, see Daly et al. (2008) in the International Journal of Climatology https://doi.org/10.1002/joc.1688. The 800m resolution data is available for a fee, while a generalized 4km version is available for free.
Key features of the 800m Dataset:
- Temporal extent & granularity: Monthly data from 1895 to the present;
- Spatial Resolution: 800m (approx. 26 arc-seconds), the native modeling resolution.
- Climate Parameters: Includes precipitation (ppt), minimum/maximum/mean temperature (tmin/tmax/tmean), dewpoint temperature (tdmean), and minimum/maximum vapor pressure deficit (vpdmin/vpdmax).
Key Methodological Features
- Topographically Aware: Explicitly models the effects of elevation, slope aspect, coastal proximity, and terrain barriers on climate.
- Weighted Regression: Assigns a weight to each station based on its distance, elevation, and topographical similarity to the grid cell being estimated.
- Moving-Window Approach: The regression is performed for each individual grid cell using a unique subset of nearby stations, ensuring local accuracy.
- Expert System: The model incorporates expert knowledge to handle complex situations like temperature inversions and rain shadows.
- Quality Control: The input station data undergoes rigorous quality control procedures before being used in the model.
- Temporal Consistency: Provides a consistent, long-term climate record suitable for time-series analysis and climatology studies.
Note
According to the PRISM Group, PRISM data should not be used to calculate long-term trends.
Bands / Layers Metadata
Each data file or layer corresponds to a single climate variable.
| Band / Parameter Code | Description | Data Type | Units |
|---|---|---|---|
| ppt | Precipitation | Float32 | mm |
| tmin | Minimum Temperature | Float32 | degrees Celsius |
| tmax | Maximum Temperature | Float32 | degrees Celsius |
| tmean | Mean Temperature | Float32 | degrees Celsius |
| tdmean | Mean Dewpoint Temperature | Float32 | degrees Celsius |
| vpdmin | Minimum Vapor Pressure Deficit | Float32 | hPa |
| vpdmax | Maximum Vapor Pressure Deficit | Float32 | hPa |
Citation
Daly, C., Halbleib, M., Smith, J.I., Gibson, W.P., Doggett, M.K., Taylor, G.H., Curtis, J. & Pasteris, P.A. (2008). Physiographically sensitive mapping of climatological
temperature and precipitation across the conterminous United States. International Journal of Climatology, 28, 2031-2064. [doi:10.1002/joc.1688](https://doi.org/10.1002/joc.1688)
Dataset Citation
When the data are used, any description should clearly and prominently state, at a minimum, our name, URL, and the dates of data creation and access. For example:
PRISM Group, Oregon State University, https://prism.oregonstate.edu, data created 4 Feb 2014, accessed 16 Dec 2024.

Earth Engine Snippet
var prism_800_daily = ee.ImageCollection("projects/sat-io/open-datasets/OREGONSTATE/PRISM_800_DAILY");
PRISM Daily Data Explorer: https://sat-io.earthengine.app/view/prism-800-daily
License
All data (gridded, polygon, tabular, graphical) retrieved from this website or otherwise provided on the website may be freely reproduced and distributed. Refer to these terms for additional information and public notice for 800m data release was noted here
Provided by: PRISM Climate Group, Oregon State University
Keywords: climate, meteorology, precipitation, temperature, CONUS, United States, gridded data, interpolation, weather, digital elevation model
Last updated: 2026-02-16
Forum Ask AI