Groundsource: A Global Dataset of Flood Events from News
Preprint Notice
This dataset is associated with a non-peer-reviewed preprint submitted to EarthArXiv (March 9, 2026). The methodology and results have not yet undergone formal peer review. Users are encouraged to review the preprint directly and exercise appropriate caution when citing or applying this dataset in research.
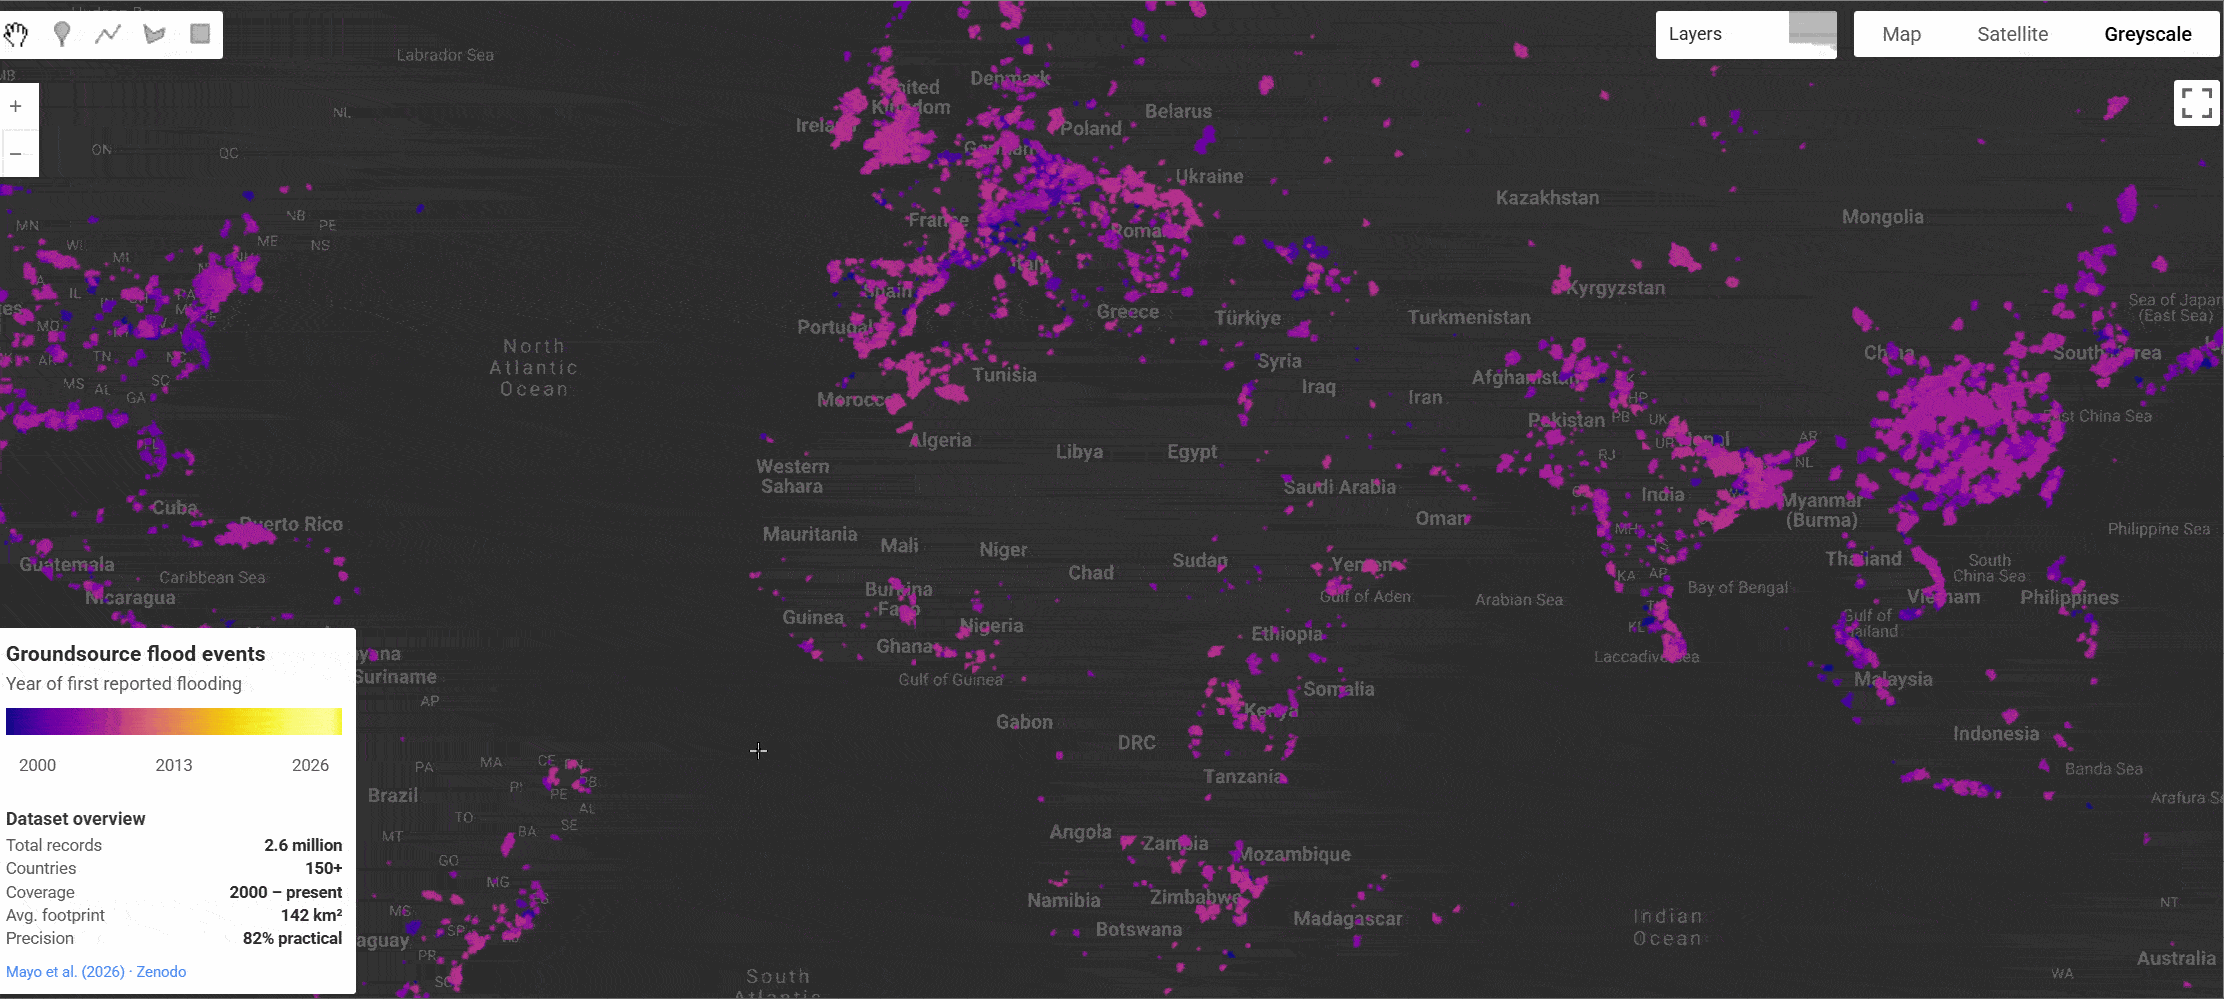
Groundsource is an open-access global dataset comprising 2.6 million high-resolution historical flood events, curated from the automated processing of over 5 million news articles spanning more than 150 countries. The dataset addresses a critical gap in global flood observation infrastructure: unlike seismic events, which are systematically recorded by standardized sensor networks, hydro-meteorological hazards lack a unified global observation system. Traditional physical stream gauge networks suffer from geographic sparsity, and satellite-derived archives are constrained by cloud cover, overpass frequencies, and a bias toward large, prolonged events.
To overcome these limitations, the Groundsource pipeline leverages Gemini large language models (LLMs) to systematically extract structured spatial and temporal data from unstructured journalistic text. News articles are ingested via Google's WebRef named entity recognition system, filtered for flood relevance, translated into English using the Cloud Translation API, and then processed by Gemini to classify events, extract flood dates, identify granular flooded locations, and reconcile place names against standardized geographic databases via the Google Maps Geocoding API. The resulting event records are aggregated spatiotemporally into a flat tabular dataset with daily temporal resolution and localized spatial boundaries, covering the year 2000 to the present. The Groundsource dataset is available for download from Zenodo: Groundsource Zenodo Repository. The preprint describing the full methodology is available at EarthArXiv.
Key Features and Details
- Total Records: 2,646,302 individual flood event observations
- Temporal Coverage: 2000 to present (daily resolution)
- Spatial Coverage: 150+ countries globally
- Average Spatial Footprint: 142 km² per event; 82% of events under 50 km²
- Source Articles Processed: Over 5 million news articles across 80 languages
Dataset Schema
Each row in the dataset represents a distinct spatiotemporal flood observation. The following fields are provided for every record:
- uuid: A unique identifier for each record
- area_km2: Area of the reported location polygon in square kilometers
- start_date: The initial day (YYYY-MM-DD) for which there is documented textual evidence of an ongoing flood
- end_date: The final consecutive day (YYYY-MM-DD) for which there is documented evidence of the flood; identical to start_date for single-day events
- geometry: The spatial boundary of the reported location in WGS 84 (EPSG:4326), either a complex polygon (e.g., administrative district) or a buffered point (e.g., a specific street intersection)
Note that the dataset is entity-based rather than meteorology-based. A single large-scale meteorological flood may produce multiple entries corresponding to independently reported geographic entities (neighborhoods, towns, districts) that were inundated.
Known Limitations and Biases
Users should be aware of the following systematic characteristics of the dataset before applying it in research:
- Temporal recency bias: Approximately 64% of all recorded events fall between 2020 and 2025, reflecting the exponential growth of digitized online news rather than a physical increase in flood frequency. Older events are underrepresented due to the relative scarcity of digitized archival news and link decay.
- Spatial media bias: Event density correlates with regional digital news infrastructure. Regions with sparse digital media or where local news is published in languages outside the 80 supported by the Read Aloud API are systematically underrepresented. Recall drops to 39% (GDACS) in Papua New Guinea and 50% in Gabon, versus 96% in the United States.
- Severity-dependent recall: Higher-impact events are more likely to be reported in news media and thus captured. Recall against GDACS red-alert events reaches 99%, while green-alert events (nationally manageable) achieve 82%.
- Non-i.i.d. errors: Geocoding errors may be spatially clustered (e.g., ambiguous place names in specific languages or regions), meaning error rates may not be uniform across geographies.
Citation
Mayo, R., Zlydenko, O., Bootbool, M., Fronman, S., Gilon, O., Hassidim, A., Kratzert, F., Loike, G., Matias, Y., Nakar, Y., Nearing, G., Sayag, R., Sicherman, A., Zemach, I., &
Cohen, D. (2026). Groundsource: A Dataset of Flood Events from News. EarthArXiv. Unreviewed preprint.
Mayo, R., Zlydenko, O., Bootbool, M., Fronman, S., Gilon, O., Hassidim, A., Kratzert, F., Loike, G., Matias, Y., Nakar, Y., Nearing, G., Sayag, R., Sicherman, A., Zemach, I., &
Cohen, D. (2026). Groundsource: A Dataset of Flood Events from News [Data set]. Zenodo.
https://doi.org/10.5281/zenodo.18647054
Earth Engine Snippet
License
The dataset is made available under Creative Commons Attribution 4.0 International (CC BY 4.0)
Keywords: flood events, hydro-meteorological hazards, LLM extraction, news media, global flood database, flash floods, disaster risk, Gemini, spatiotemporal data, hydrological modeling
Curated in GEE by: Samapriya Roy
Last updated in GEE: 2026-03-16
Forum Ask AI